
Solutions
Switchgear Hot Spot Temperature Monitoring
- Categories:Solution
- Time of issue:2020-01-02 00:00:00
- Views:0
Solution of Fluorescent Optical Fiber Online Temperature Monitoring for Switchgear
1. Overview
Switchgear is the key equipment of power generation, transmission and transformation system. Their safety, reliability and service life are very important to the safe and reliable operation and service life of the whole transmission and transformation system. Most of these high-voltage equipment are enclosed structure. They work in the environment of high voltage, high current and strong magnetic field for a long time. Some joints are heated due to aging or excessive contact resistance, which results in heat accumulation. Heating temperature rise increases the loss of power transmission system. If the heat dissipation is not good, it will endanger the normal operation of equipment, even cause faults. The adverse social impact and economic losses are immeasurable. Many physical and chemical changes (such as partial discharge and partial overheating) inside the switchgear will cause the temperature parameters of the switchgear to change, which makes the temperature rise track of the switchgear different from the normal operation. Temperature plays a decisive role in the aging of insulating materials, so it is particularly important to accurately measure the temperature of switchgear. With the continuous improvement of the automation level of safe power consumption and distribution network, besides monitoring the electrical parameters, direct monitoring of the hot spot temperature of high voltage electrical equipment such as transformer/switchgear/large motor can improve the safe operation of equipment, prolong the insulation life of equipment, instantly judge the actual load capacity of equipment, and maximize the transmission and transformation potential of switchgear to improve the installation. The economic benefits of preparation are of great significance.
2. Comparison of Several Main Temperature Measurement Methods of Switchgear at Present
2.1 Infrared Temperature Measurement
Infrared thermometer is suitable for manual inspection and temperature measurement. Due to its flexible use, it has become an important means of temperature detection for high-voltage power equipment. The disadvantage of infrared thermometer is its large volume, high cost, general precision (related to distance), especially its inability to realize on-line real-time monitoring. In addition, infrared ray cannot diffract through the shield and accurately measure the temperature of key contacts, which limits its application in some occasions. Infrared temperature measurement is a non-contact temperature measurement, which is vulnerable to the interference of the environment and the surrounding electromagnetic field. In addition, the space in the switchgear cabinet is very narrow, so it is impossible to install the infrared temperature measurement probe (because the probe must keep a certain safe distance from the object under test and need to be directly on the surface of the object under test), and its temperature measurement accuracy is vulnerable to environmental impact, such as light intensity and fog, will have a certain impact on its measurement accuracy, so its scope of use is greatly restricted.

Infrared Thermography Temperature Measurement System
2.2 Wireless Temperature Measurement
The existing wireless temperature measurement scheme uses batteries or CT to supply power to the temperature measurement chip, and then transmits the signal from the temperature measurement chip through wireless chip. Although this scheme realizes the wireless transmission of temperature signal, it needs battery power supply or CT power supply because it belongs to active scheme. Battery power supply needs regular replacement of batteries, and the poor high temperature resistance of batteries in summer has an impact on the operation of the power sector. CT energy acquisition exists if the current of the joint is small, the power cannot be taken out, then the sensor head stops working, and if the current of the joint is large, it is easy to burn CT until the sensor is burned. Using CT energy, the size of the sensor head is large and the location of the sensor head has a great influence on the efficiency of energy acquisition, which lacks universal adaptability. It is necessary to control the magnetic saturation curve for optimum parameters for CT fabrication. If the parameters are not selected properly, the circuit of the sensor will be damaged and the reliability will be affected.
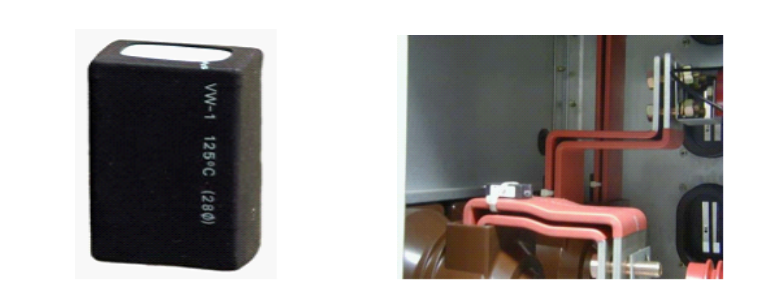
Wireless Temperature Measurement System
2.3 Optical Fiber Temperature Measurement
With the development of optical fiber technology, the research of high voltage measurement at home and abroad has used optical fiber technology to measure the electric parameters of power system on-line. Optical fiber transmission system is especially suitable for high voltage measurement because of its high insulation strength, strong anti-electromagnetic interference ability, corrosion resistance, small size and simple structure. Optical fiber thermometer transmits signal by optical fiber. Its temperature sensor head is installed on the surface of charged object, and the thermometer is connected with temperature sensor by optical fiber. Optical fiber temperature measurement can be divided into distributed optical fiber temperature measurement, optical fiber grating, fluorescent optical fiber temperature measurement and other methods. Among them, fluorescent optical fiber temperature measurement has the most obvious advantages, such as long life, no need to calibrate, small probe size and easy installation. The application of fluorescent optical fiber temperature measurement equipment in the United States has been more than 20 years, and many of them are used in such highly demanding environment as 500 KV transformer winding. Facts have proved that the products are safe and reliable.
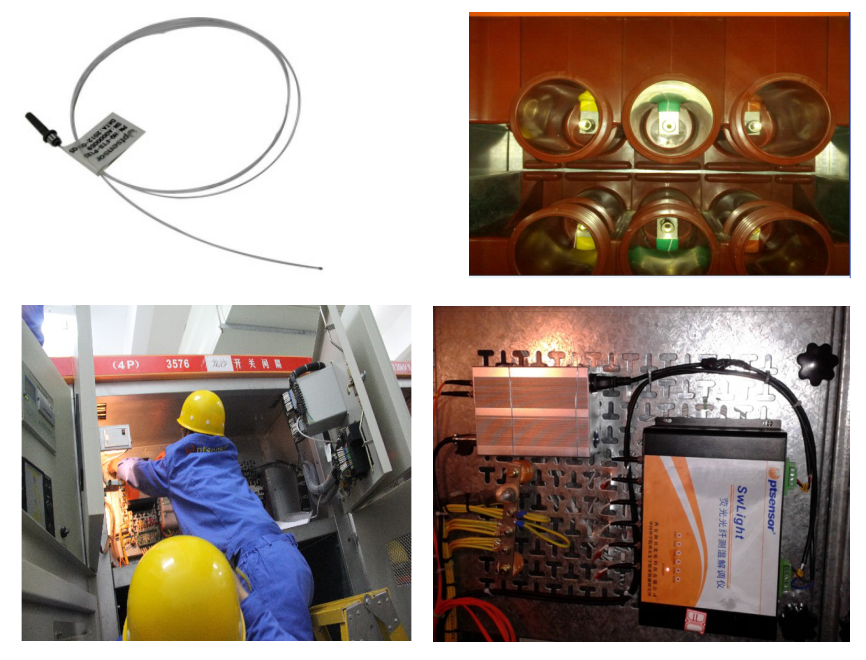
Fluorescent Based Optical Fiber Temperature Monitor for Switchgear
3. Herch’s On-Line Fluorescent Optical Fiber Monitoring System
The fluorescent optical fiber on-line monitoring system is a temperature monitoring system designed by Herch for the early prediction of faults and fires caused by insulation ageing or poor contact of high voltage power equipment such as switchgear, cable connectors and transformers in substations. Due to the optical fiber has the characteristic of electrical insulation, intrinsic safety and immunity from electromagnetic interference. The probe of the sensor can be directly installed at the measured point, and the real-time temperature of the measured point can be monitored to predict possible faults and prevent the occurrence of electrical fires.
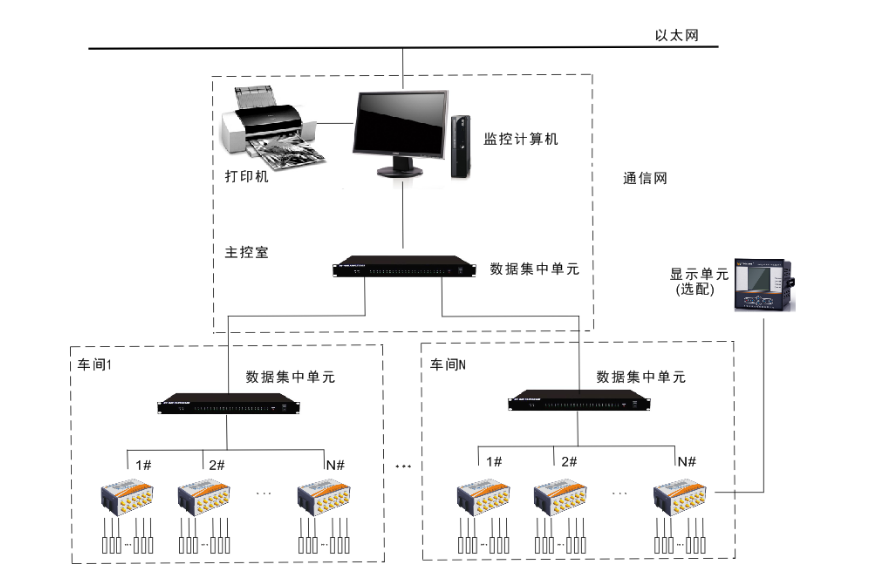
This system is composed of HQ-12 switchgear "hot spot" fluorescent optical fiber temperature measurement system, data centralization unit, upper monitor computer and human-computer interaction software.
Switchgear Optical Fiber Temperature Measurement Overall Plan
3.1 Herch’s Switchgear "Hot Spot" Fluorescent Optical Fiber Temperature Measurement System
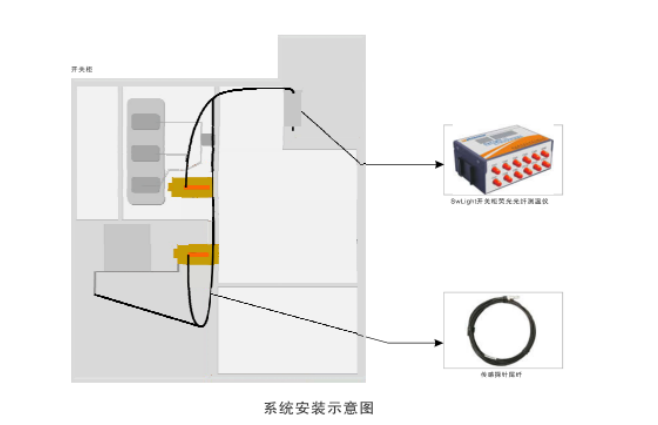
Herch’s switchgear "hot spot" fluorescent optical fiber measurement system is designed for oil-immersed transformers, dry-type transformers, switchgear, knife switch and other "hot spot" temperature monitoring. It consists of HQ-12 optical fiber temperature monitor and SwLight fiber optical sensor:
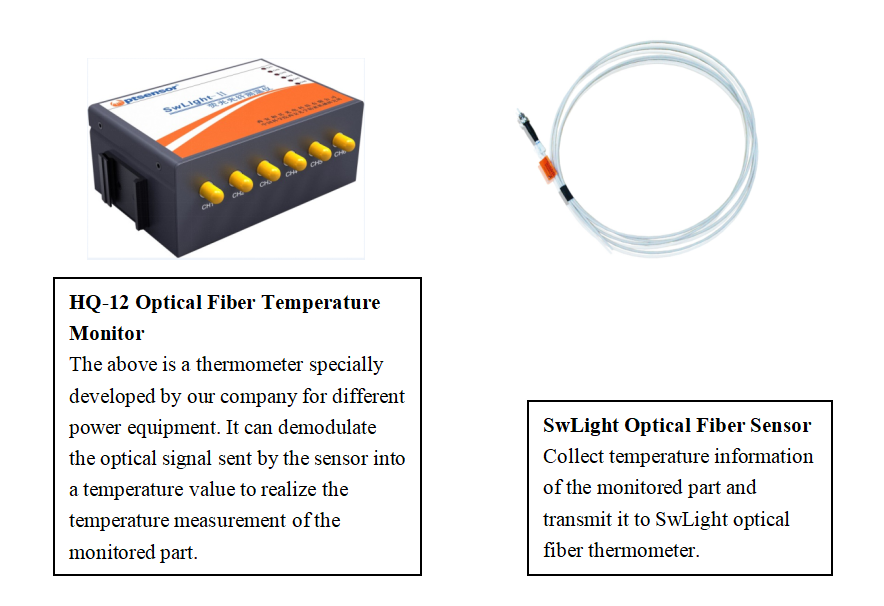
3.2 HQ-12 Optical Fiber Thermometer
SwLight optical fiber thermometer receives real-time optical signal with temperature information from optical fiber sensor, demodulates it to temperature value, and realizes temperature measurement of monitored parts. When the actual measurement value is larger than the alarm setting value, the alarm signal is sent out. They have the functions of temperature display, alarm setting, acousto-optic alarm and fault diagnosis. They can work independently on a single machine, and can also be used by multiple networking units. They are suitable for application needs of various scales.
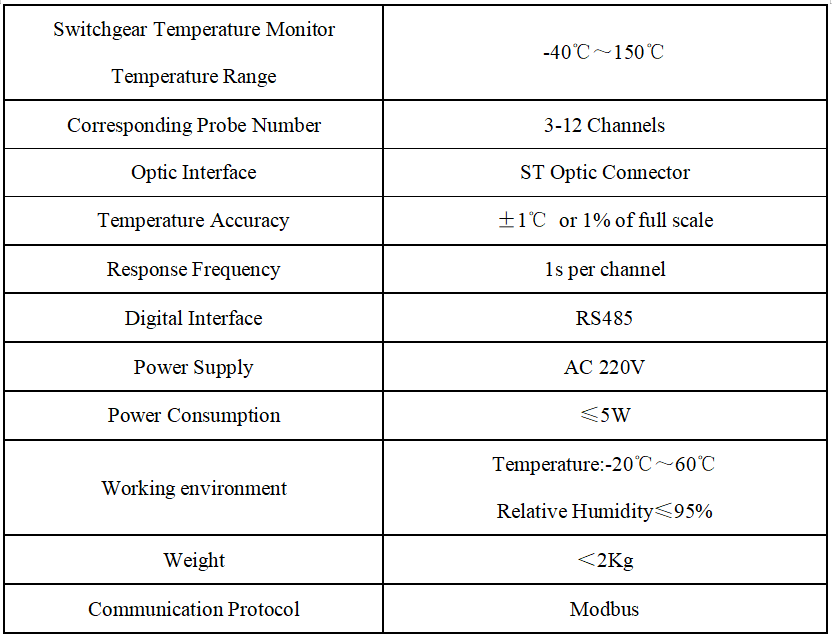
Main Specifications
3.3 Principle of Temperature Measurement
The basic principle of fluorescence thermometry is that some rare earth substances emit light after being stimulated by external light. Even when the external excitation stops, they will continue to emit light independently for a period of time, which is related to temperature. Temperature can be retrieved by measuring the time of fluorescence afterglow.
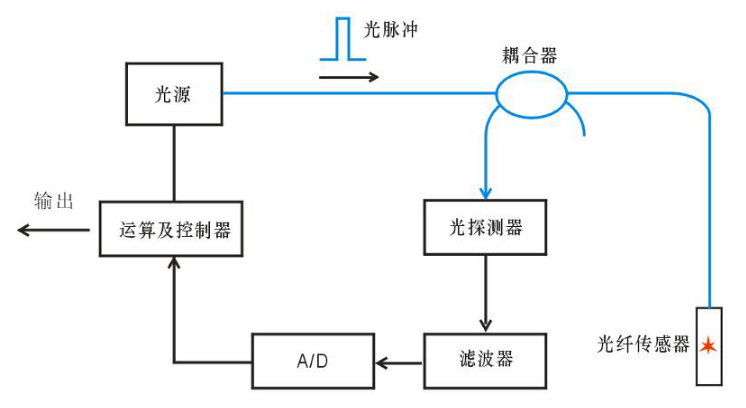
Functional Block Diagram of Temperature Measurement System
The functional block diagram of the temperature measurement system based on fluorescence mechanism is shown in the figure above. The specific steps are as follows:
1. The light source emits a light pulse, which is modulated by a coupler and injected into the optical fiber sensor.
2. Optical fiber sensor reflects back a light signal of a specific wavelength, which carries the temperature factor of the measured point.
3. The signal processing circuit analyses and calculates the optical signal to get the actual temperature of the measured point.
3.4 SwLight Optical Fiber Sensor
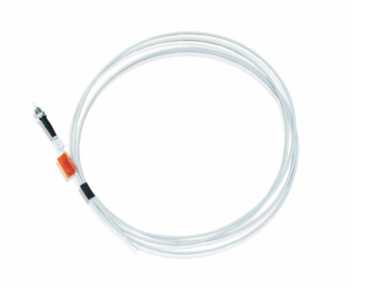 This optical fiber uses LumaProbe SP series optical fiber sensors for matching, the probe size is very small, can be directly installed at the measured point, temperature measurement is accurate, fast response; its tail fiber uses soft, strong special optical fiber, it has the advantages of high transmission bandwidth, signal stability, electromagnetic interference resistance, flexure resistance, high impact strength and fast connection.
The material of tail fiber sheath is PTFE. It has the characteristics of high temperature resistance, aging resistance, corrosion resistance, high insulation, non-adhesion, etc. It can adapt to the harsh environment of high voltage, high temperature, strong electromagnetic and so on.
Main performance indicators
l Temperature range: -40 to 150℃
l Size: diameter 2.3mm
l Pigtail length: 1-20M
l Fiber Connector: ST fiber connector
Product advantages
Compared to traditional electrical sensors, optical fiber sensors have the following advantages;
l It can realize multi-channel multi-point temperature monitoring and is suitable for large-scale temperature point monitoring;
l High measurement accuracy and resolution;
l Sensing quantity detection and transmission are optical signals, which are not affected by electromagnetic interference and nuclear radiation;
l Good environmental adaptability, long-term use in harsh environments such as high temperature, high humidity and chemical attack;
l Light weight, small size, easy to install and use.
4. The Background Software System
4.1 Overview
If the project requires, our products can be displayed with separate background software. The main functions of the software system include real-time temperature local monitoring, real-time data remote monitoring, high/low temperature alarm, high/low temperature early warning, historical data playback, pre-alarm and post-alarm curve, temperature export to Excel and other functions.
4.2 System Architecture Diagram
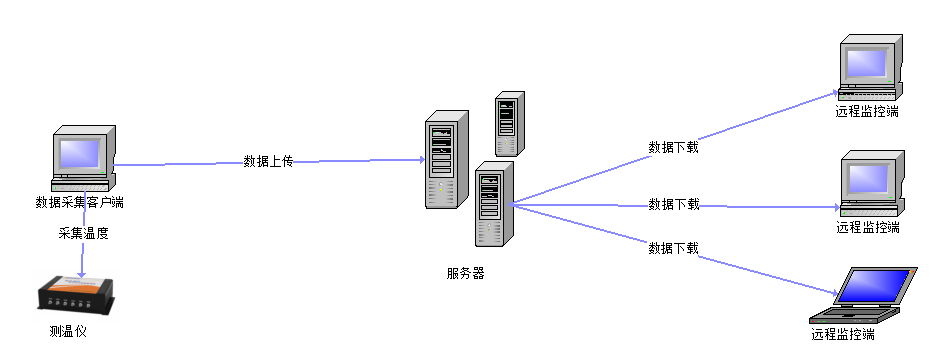
4.3 Monitoring Data Software System
4.3.1 Data Acquisition Software
4.3.1.1 Line Self-Test and Fault Location
With self-test function, it automatically detects abnormalities of temperature measurement points, displays errors. It facilitates system debugging, maintenance and error location.
4.3.1.2 Temperature Measurement Point Temperature Display
Ø Displays the real-time temperature value of the temperature measurement point of the power device;
Ø Shows the temperature rise of the temperature measurement point of the power equipment;
Ø Shows the temperature rise rate of the temperature measurement point of the power equipment (the temperature difference between two acquisitions / the time interval);
Ø High/low temperature alarm function;
Ø High/low temperature warning function.
Schematic diagram of temperature measurement point display:
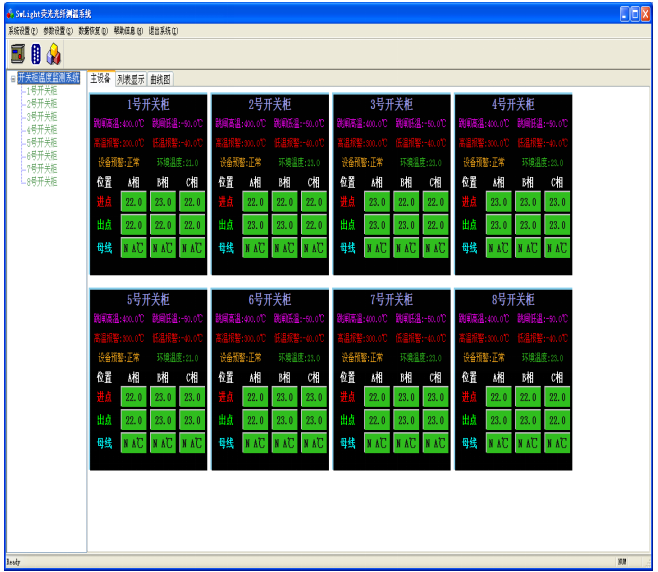
Temperature Display of Temperature Measurement Point
4.3.1.3 Temperature Curve
Ø The temperature change curve shows the function.
Temperature curve:
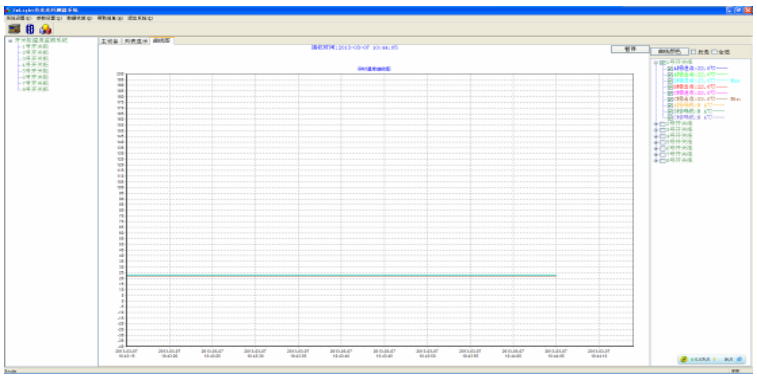
Temperature Curve
4.3.1.4 Temperature Warning and Alarm
Ø High temperature alarm function.
Ø Low temperature alarm function.
Ø High temperature warning function.
Ø Low temperature warning function.
Ø The temperature rise rate is too high.
Ø The temperature rise rate is too low.
Ø Text alarm function.
Ø Sound and light alarm function.
4.3.1.5 Data Inventory
Ø Data saving
The collected temperature data is stored according to the save time interval set by the user.
Ø Automatic backup
Automatically back up the database based on the maximum amount of data set by the user.
4.3.1.6 Network Transmission Function
Ø Temperature upload
The collected temperature data is uploaded according to the server parameters set by the user and the time interval of uploading the network.
4.3.1.7 Historical Temperature
Ø List shows historical data
The historical temperature data is loaded according to the time period list selected by the user.
Ø Graph playback function of historical temperature data.
Historical temperature data is exported to the function of the Excel table. Historical temperature interface diagram as shown below.
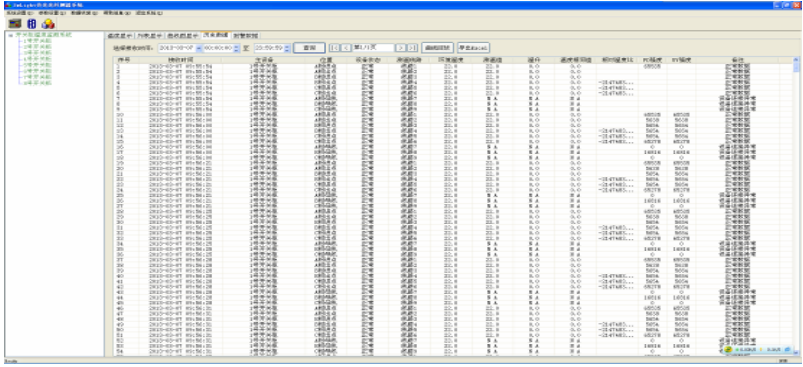
Historical Data List
4.3.1.8 Historical Alarm Temperature
Ø List shows historical alarm temperature
The historical alarm temperature data is loaded according to the time period list selected by the user.
Ø Before and after the alarm
Select an alarm data, set the time period before and after the alarm, and play back the temperature change during this time.
Ø The function of the alarm temperature is exported to the Excel table.
The historical alarm temperature interface diagram is as follows:
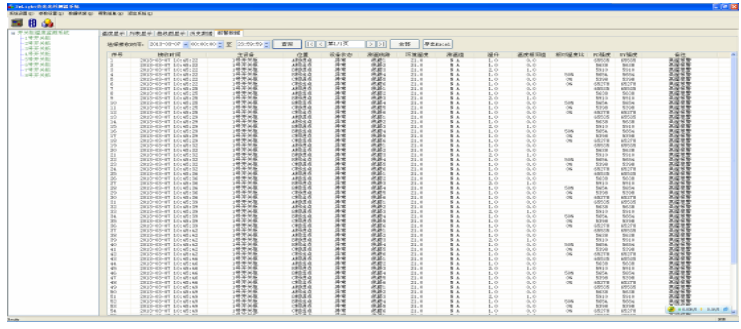
Historical Alarm Temperature List
4.3.2 Server Software
4.3.2.1 Network Transmission Function
Ø Network receiving and processing data
Receive data or instructions transmitted by the client, analyze and process.
4.3.2.2 Log Printing Function
Ø Log printing
Every action on the server is written to the log so that problems can quickly locate the problem.
4.3.2.3 Data Inventory Function
Ø Temperature data save
According to the time period set by the user, the uploaded temperature data is saved.
Scan the QR code to read on your phone
页面修改
页面修改
Contact Us
+86-18561133119
Address: Yingbin South Street, Lingcheng Economic Development Zone, Dezhou City, Shandong Province
Email:1778780643@qq.com

Scan wechat
COPYRIGHT©2020 Shandong Qinzhi Electric Co., Ltd. Back-stage Management 备案号:鲁ICP备2020042284号-1
